Discover Data from the Marketplace
Prerequisites
- You can login to Witboost
Overview
The Witboost Marketplace is a central catalog of published products that you can use to search or discover data assets that fit your business case. What ends up in the marketplace is guaranteed to be compliant to the compliance checks and quality guardrails required by the Governance team at your company.
In this tutorial, you will learn how to search for and discover products in the Marketplace. We will use the Data Mesh paradigm as our example data landscape, so you will see the term data product used interchangeably with product. You will also learn how to access the Lineage Graph for a product.
By the end of this tutorial, you will:
✅ Learn how to navigate the Marketplace and its search features.
✅ Understand how to filter and refine results to find relevant products.
✅ Explore products using the graph-based visualization tool.
✅ Know the different ways to open the Lineage Graph for product.
Searching for a product
The most direct way to find a product is to use the search bar on the Marketplace Homepage — the Marketplace landing page — which lets you find products using keywords.
- Go to the Marketplace homepage.
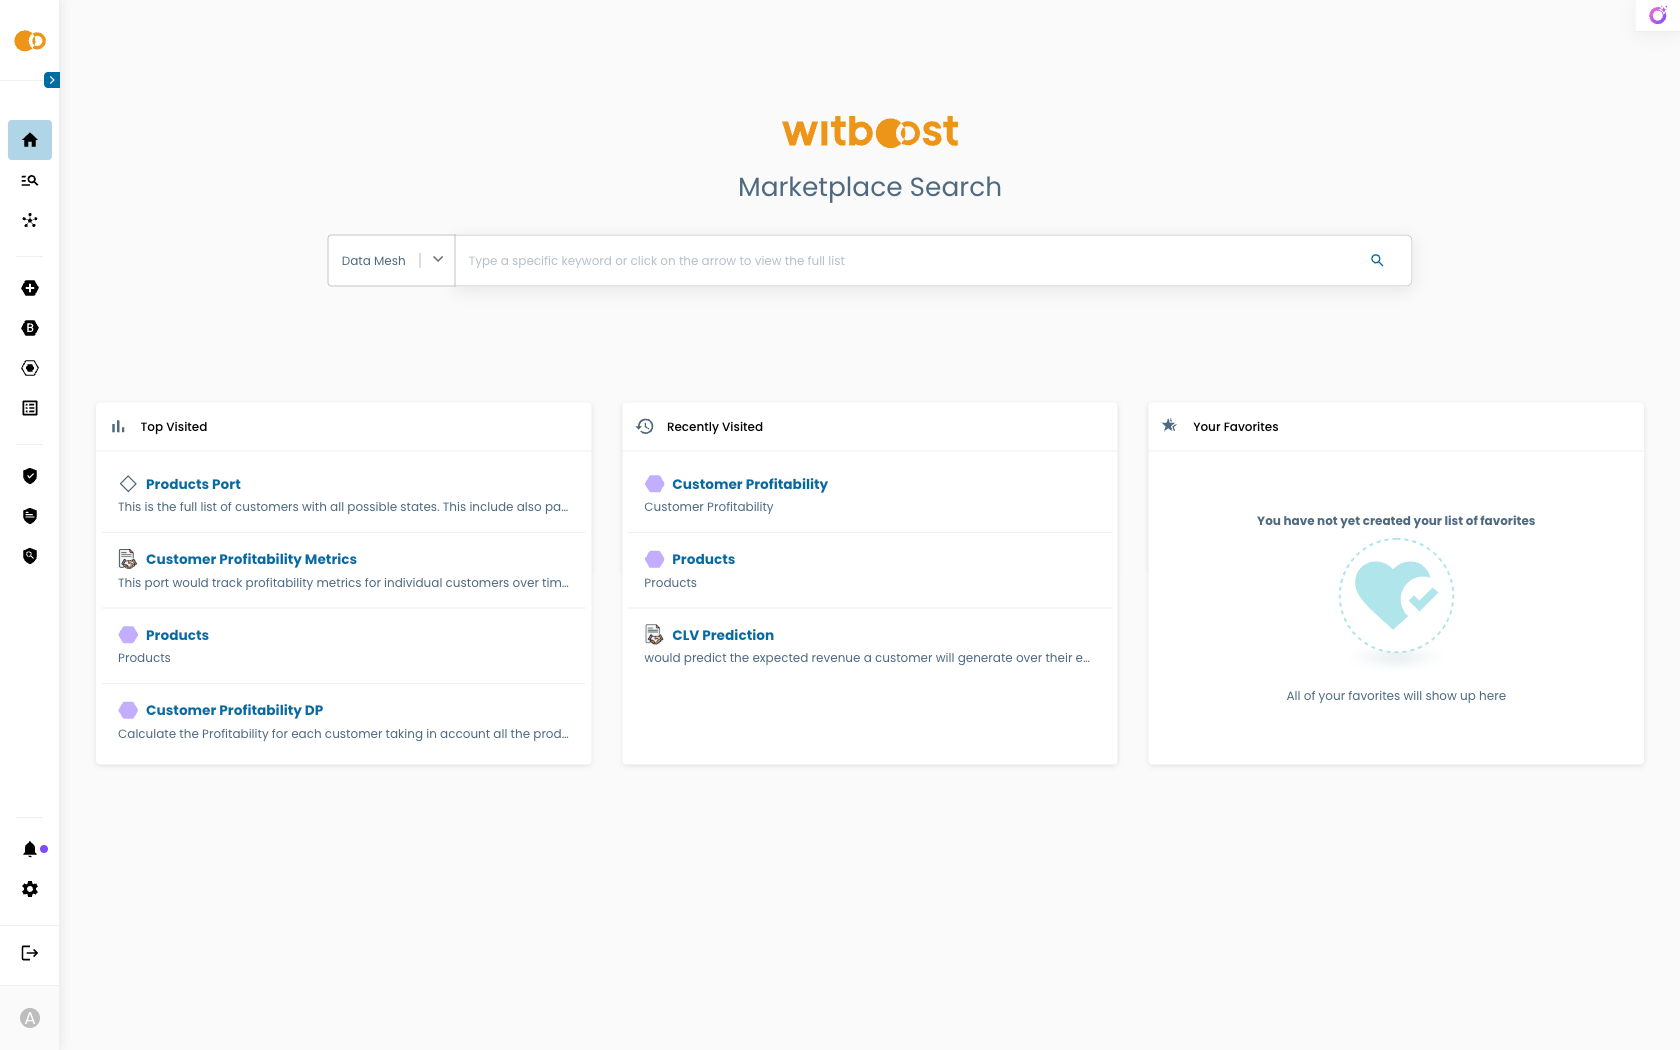
If you don't have specific keywords, or you just want to navigate the list of published projects, just press Enter to open the Marketplace Discovery page directly on the Product List tab. From there you can also switch to the Product Map tab for the visual experience described in the next section.
- Type some keywords related to the data you’re looking for (e.g., “customer analytics” or “sales trends”) and press Enter. You are taken to the Marketplace Discovery page on the Product List tab, with your query already applied, showing a list of matching products.
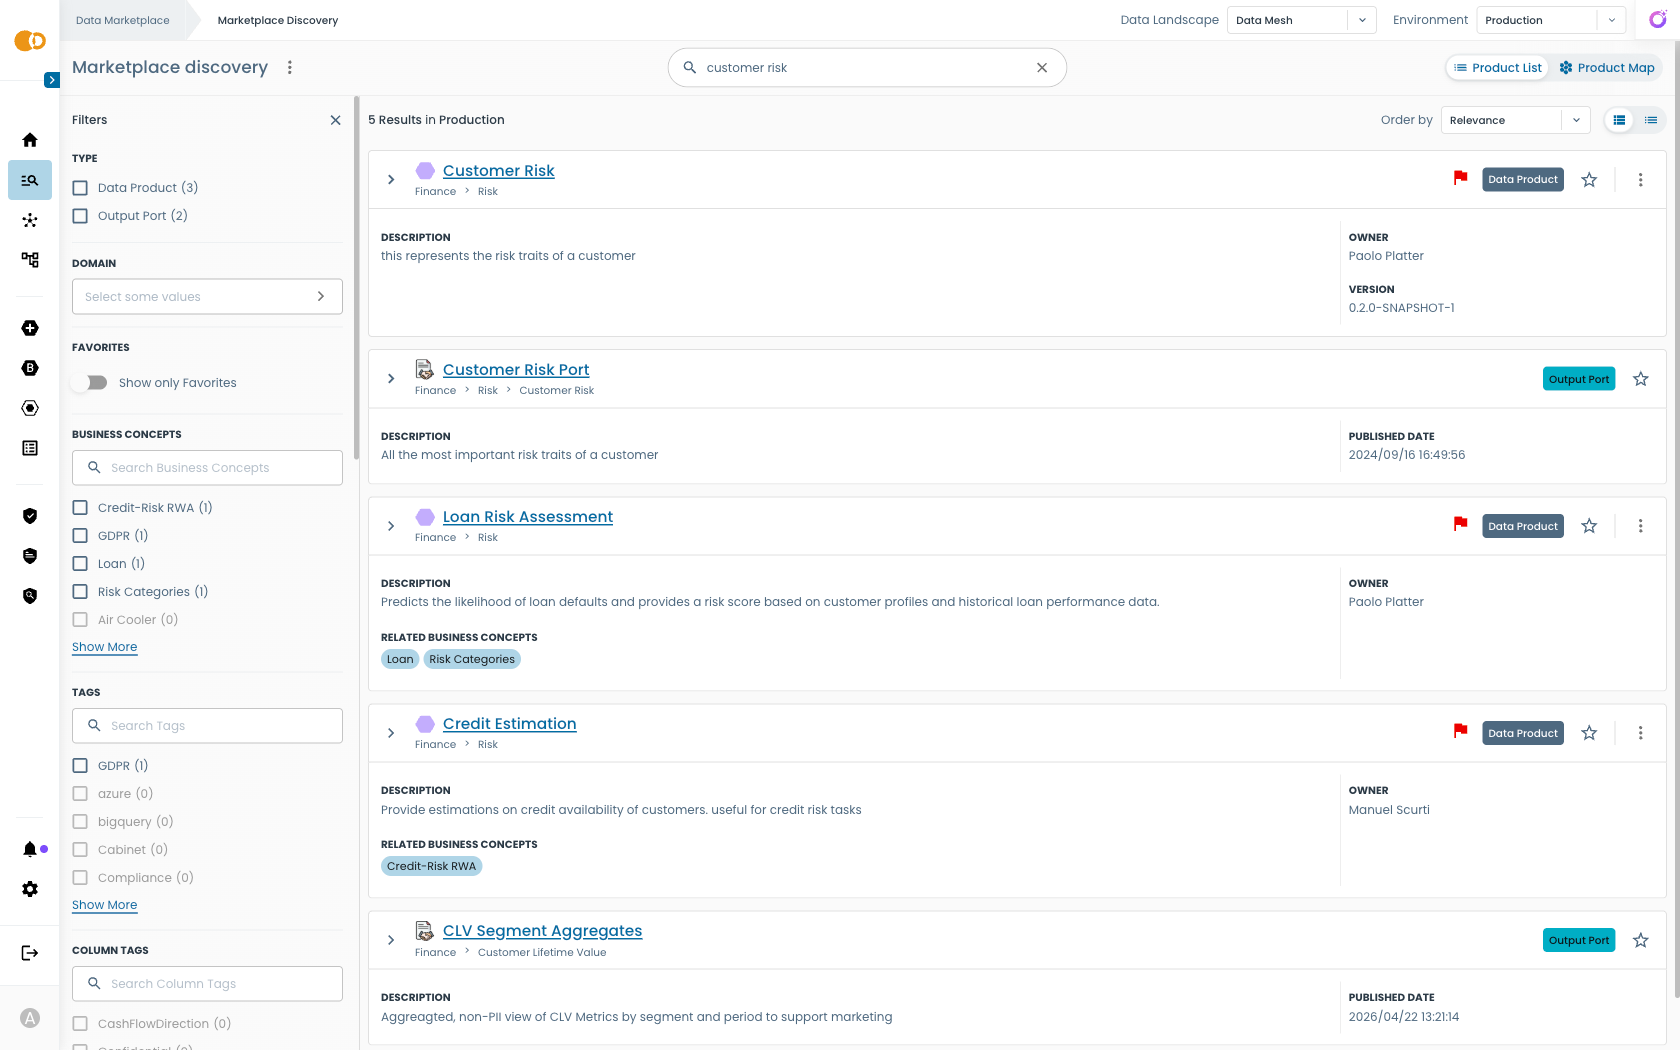
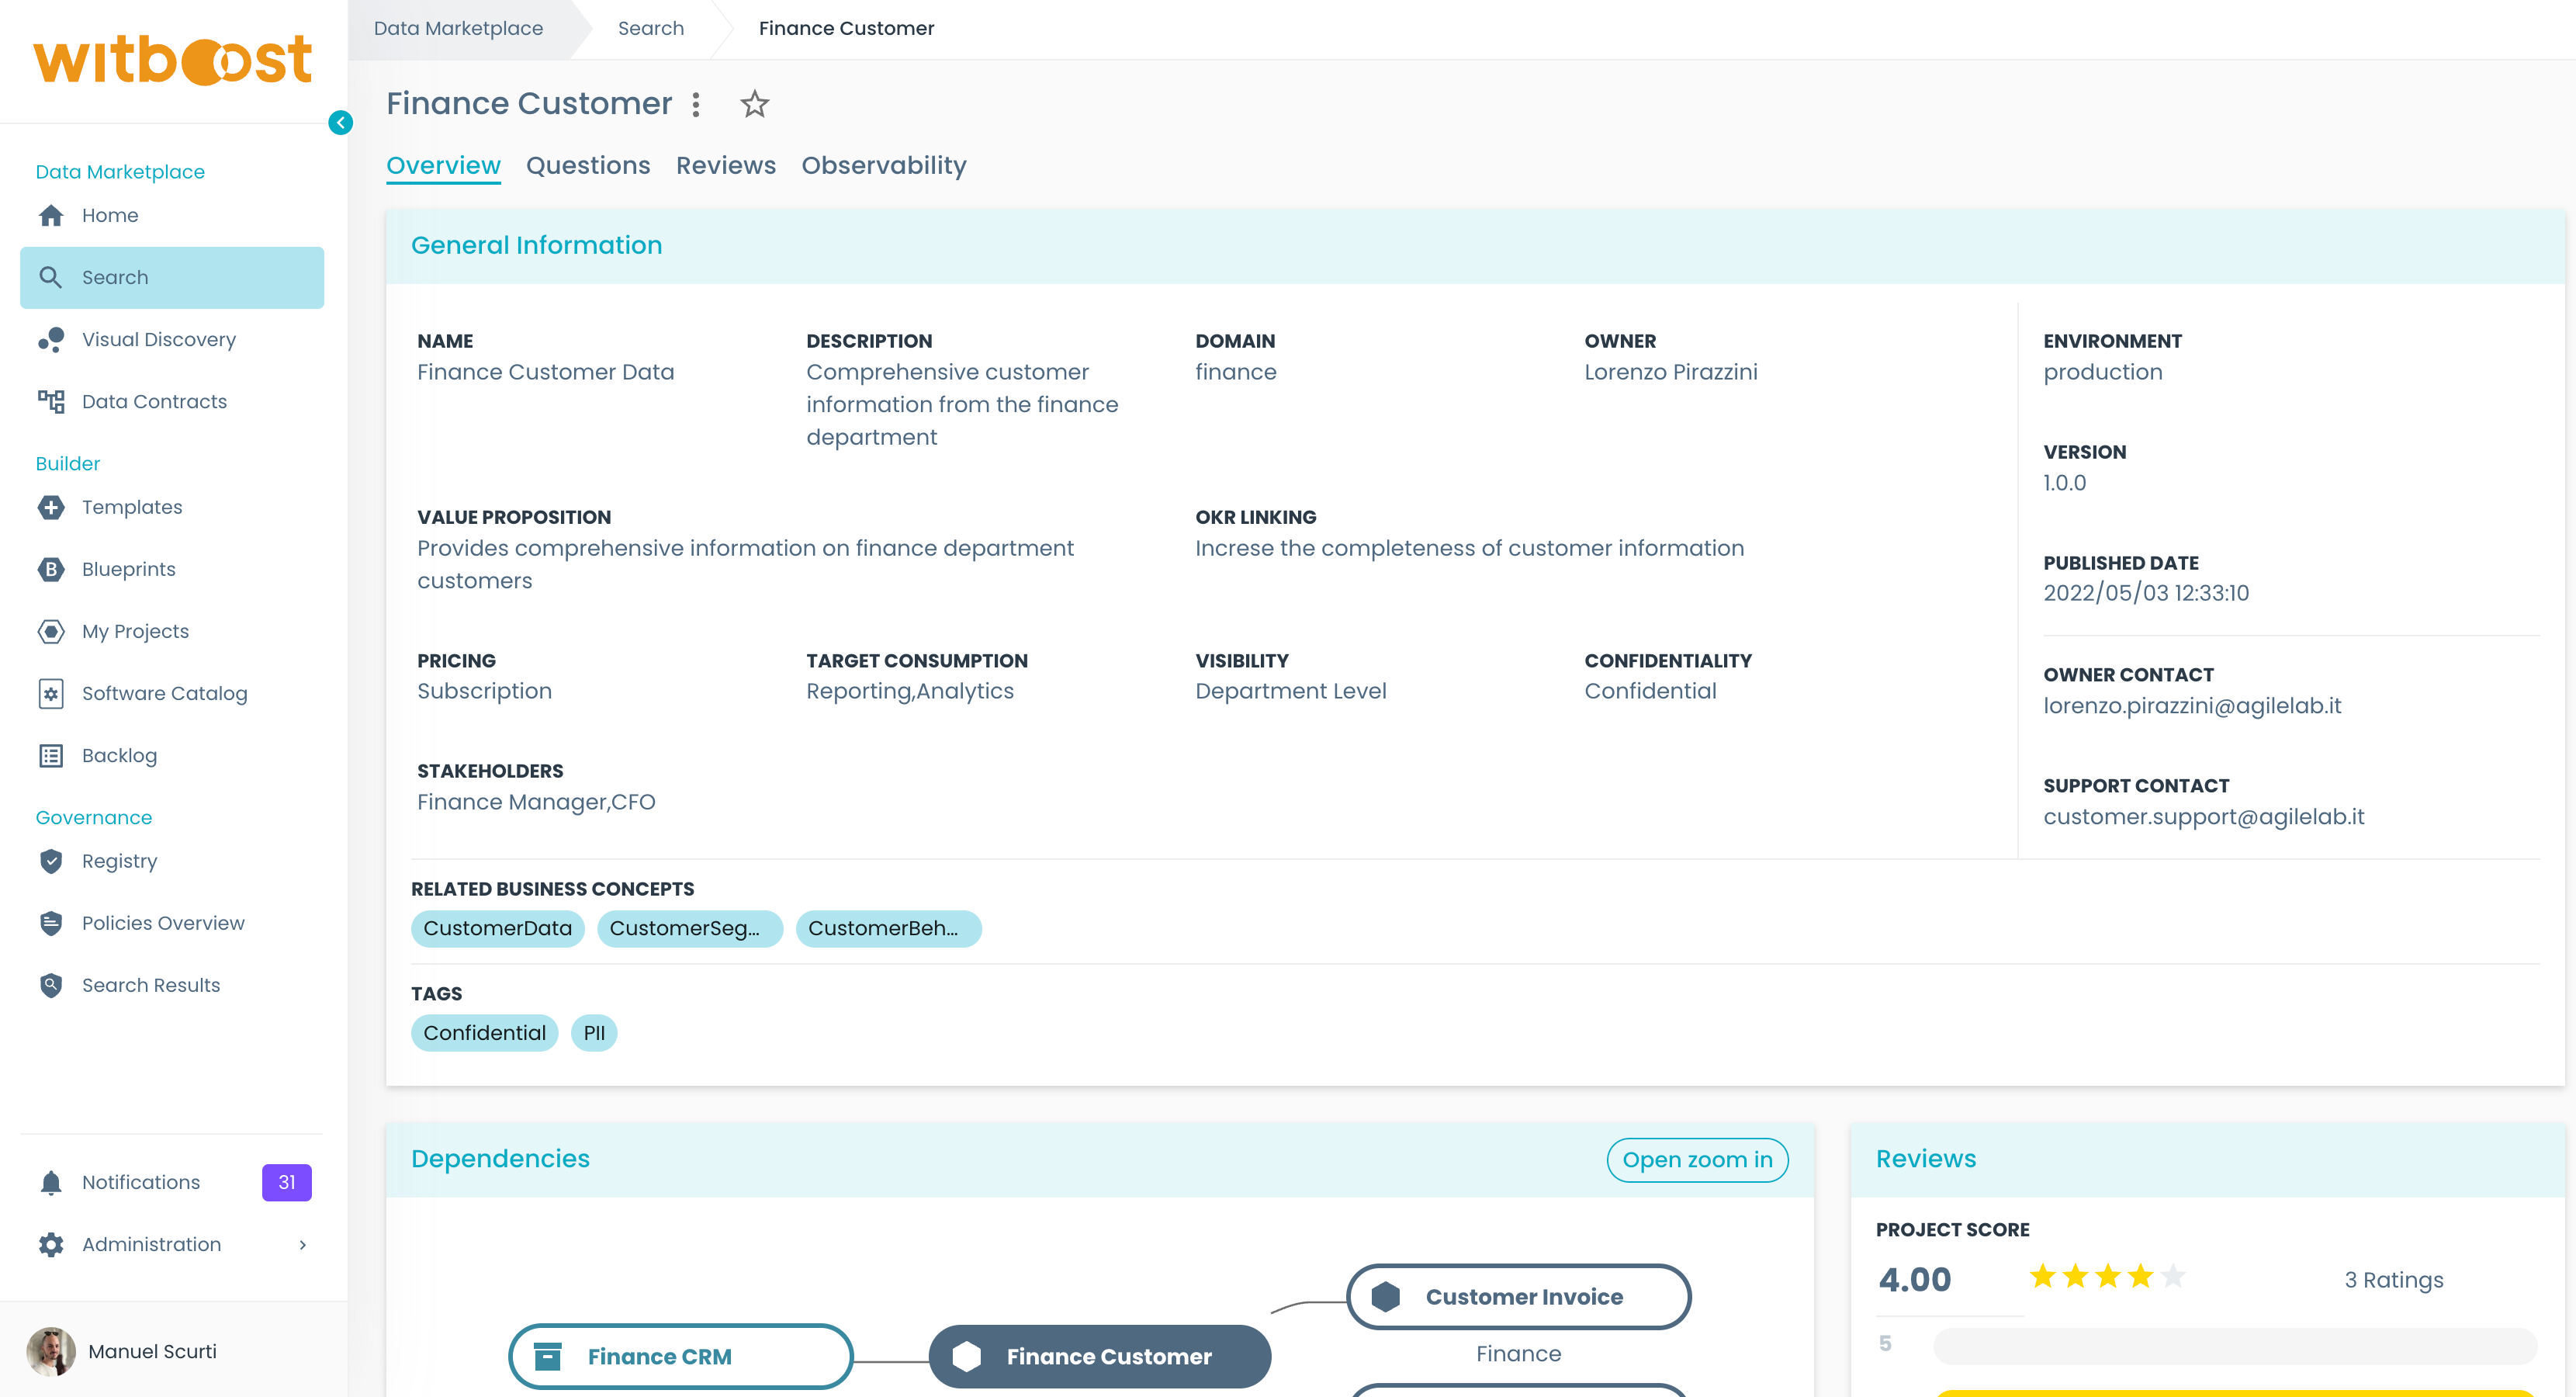
We are now looking at products that are in the Data Mesh landscape and published in the Production environment. At the top right corner you can select a different landscape and environment.
Each result will be shown from the most relevant to the least one. Each search result is presented with a set of information. Most of the times this set is composed by:
- Project Name: The title of the product
- Description: A short description of the product and its content
- Published date: A date indicating when this project has been published
- Compliance Flags: If at any given time the product is not compliant anymore with any new policy or a real time data quality check, a flag will be shown to warn interested potential consumers about the issue they may encounter when consuming this resource.
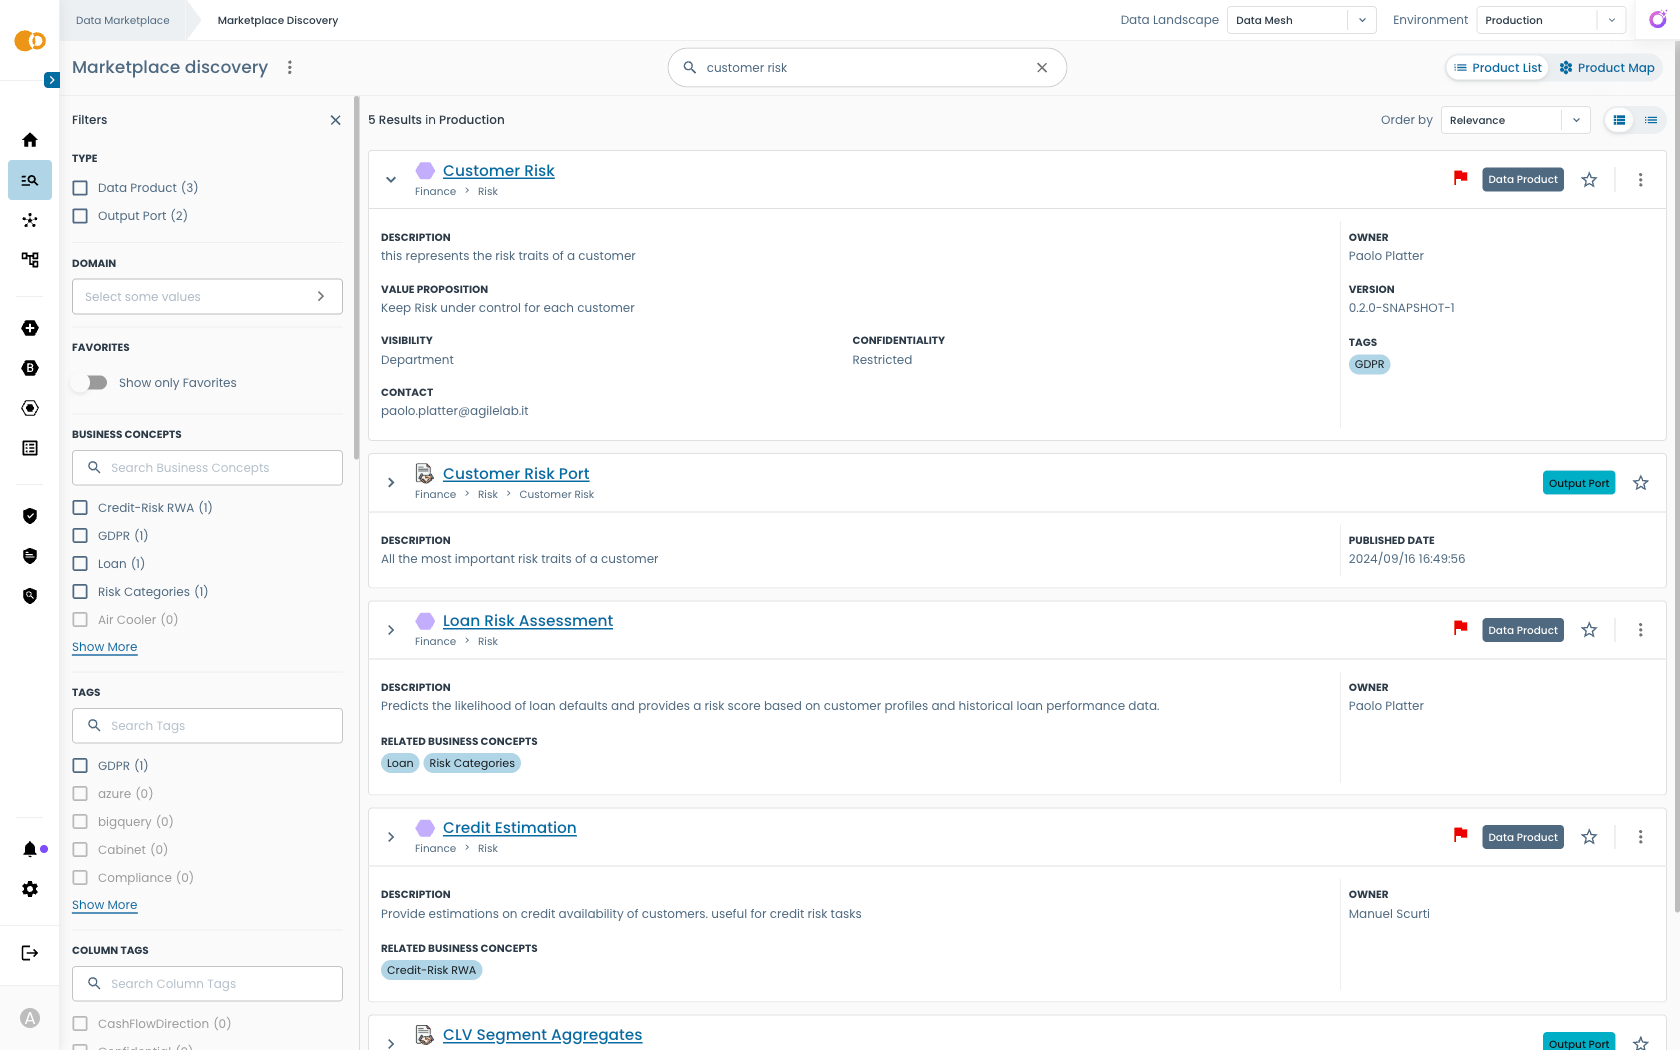
Some more information can be revealed by clicking on the Expand button
- To refine the results, you can use the filters on the left side. You can use the type filter to only show products
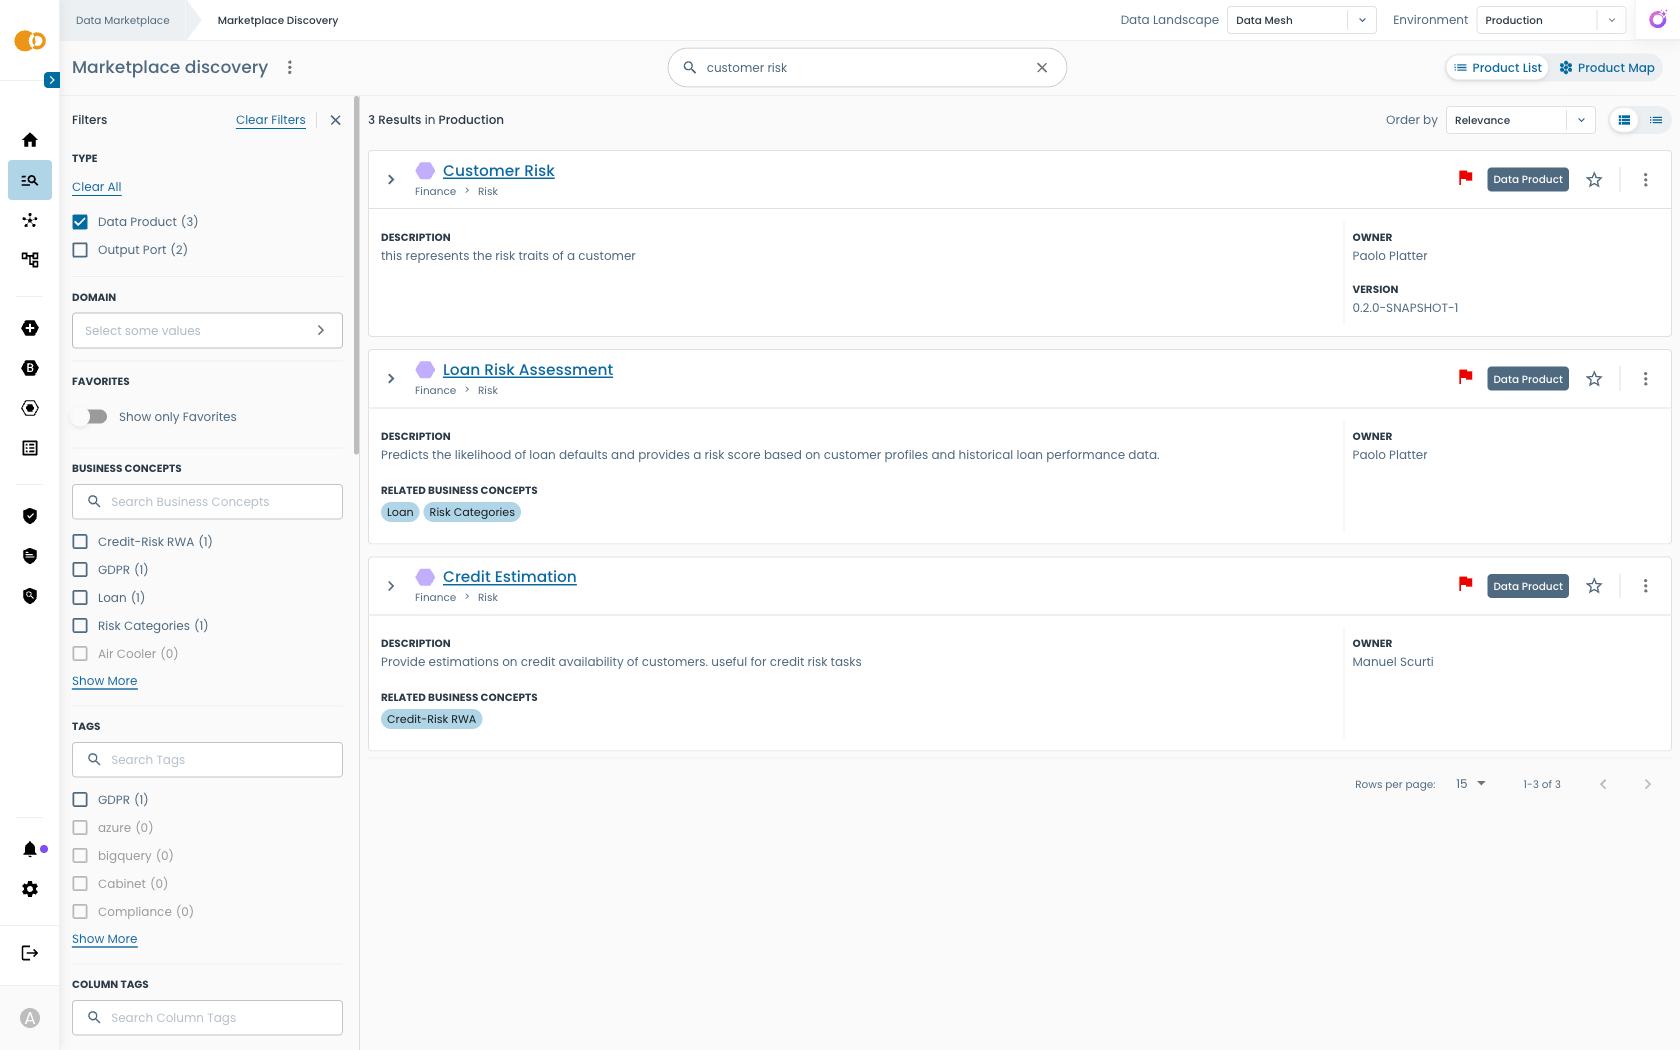
Filters may vary depending on your Witboost installation.
Exploring the Marketplace Visually
When you do not know exactly what to look for — for example, you want to get a broad view of the available products and business domains, or you want to understand how products relate to each other — you can switch to the Product Map. The same filters and search term you applied on the Product List tab are preserved, so you can move back and forth between the two views without losing context.
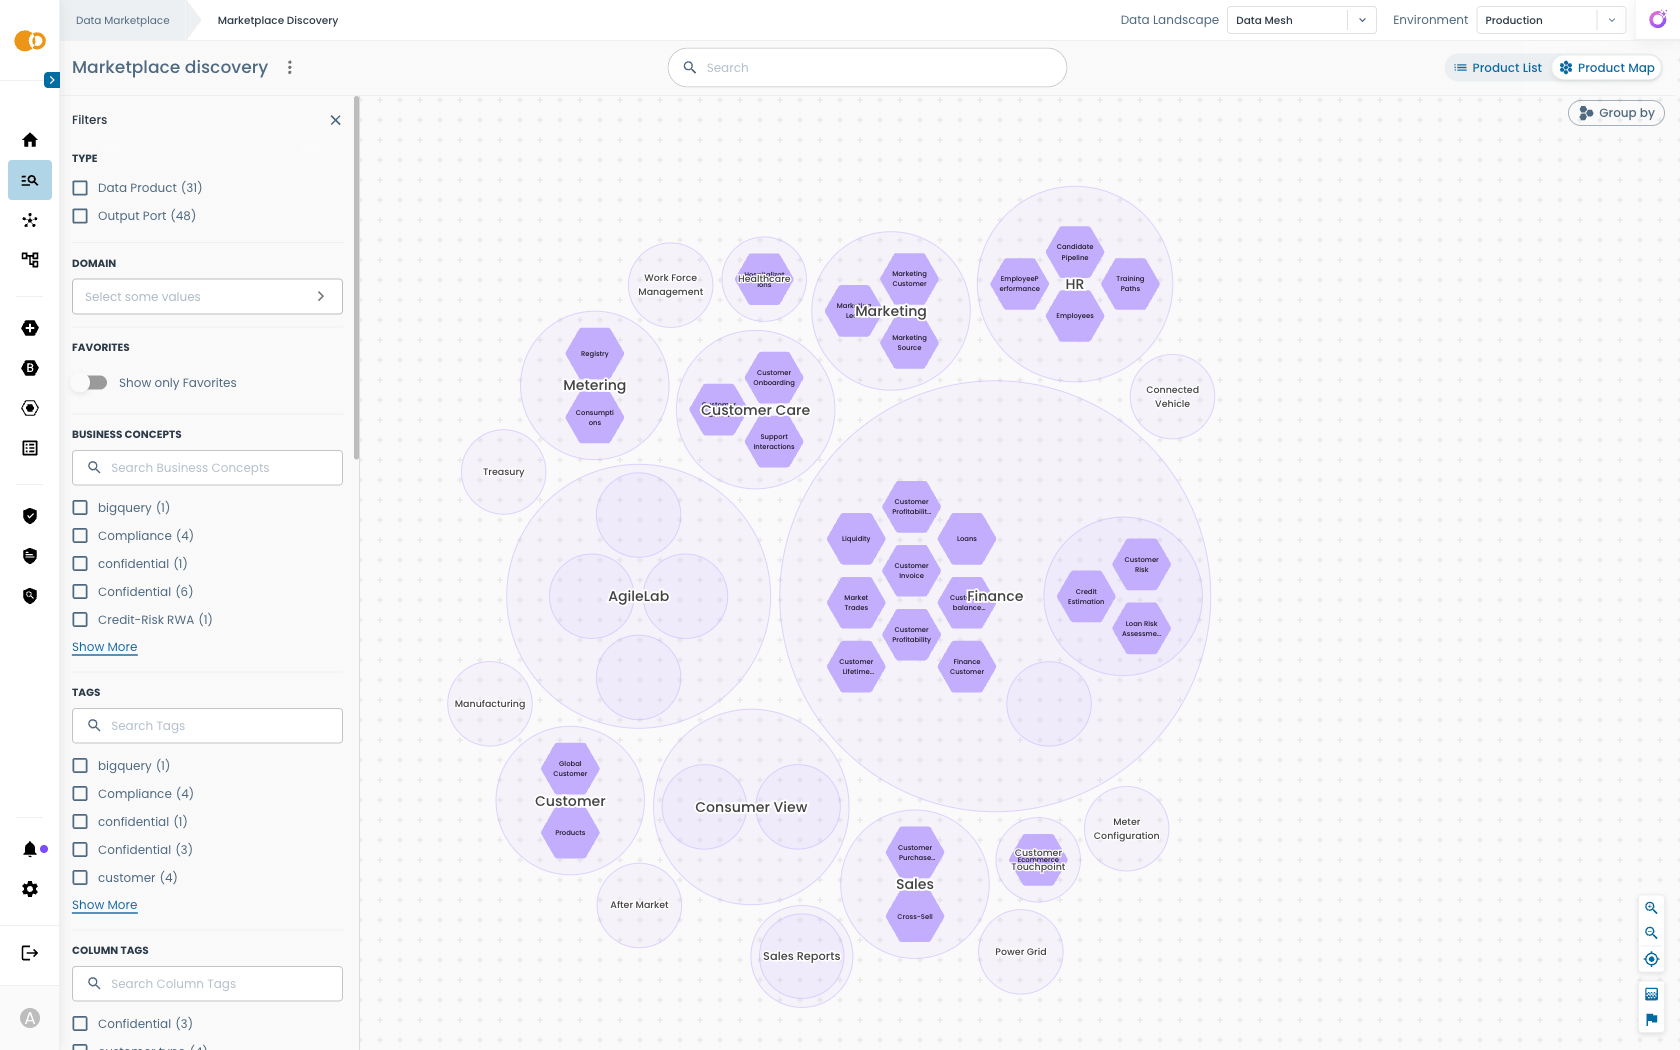 Domains and products are displayed in a navigable graph.
- Look around for the domain you are interested into. In this example, we want to take a look at products published by the Finance business domain. To zoom in, click on the Finance bubble.
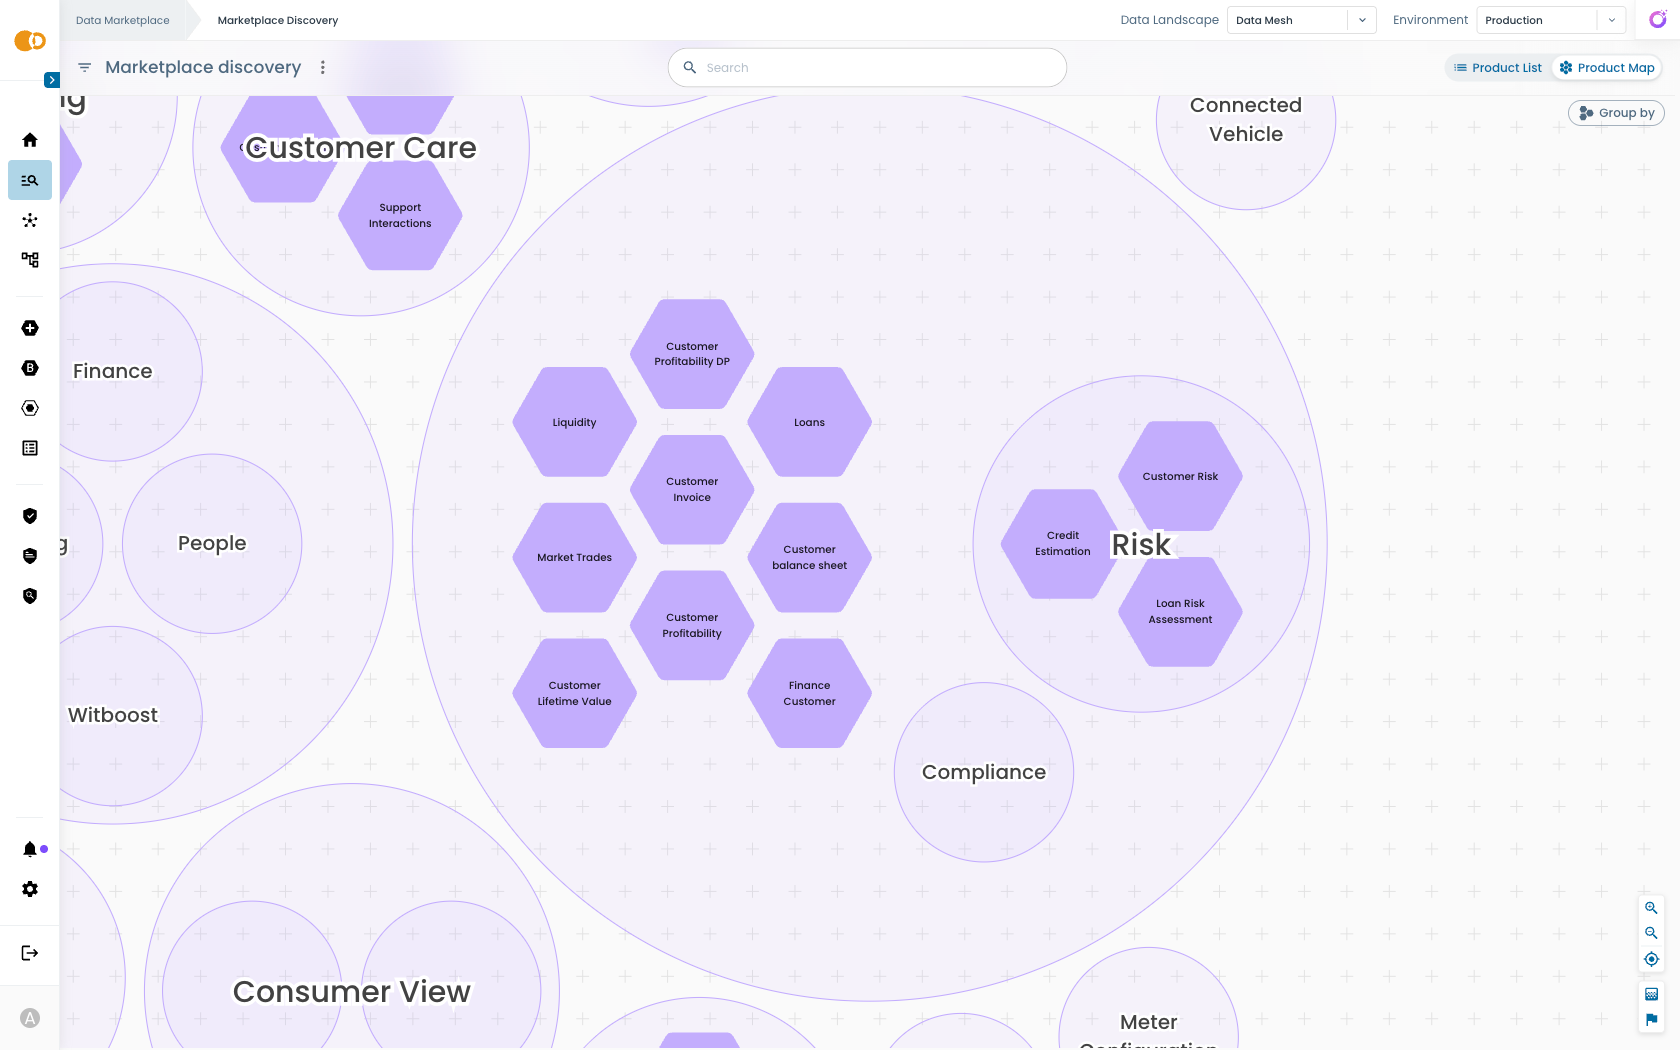
You can notice that we now have an overview on the list of products belonging to the Finance domain, but also an overview on two of its subdomains: Risk and Compliance.
- We want to get more information about the Finance Customer product, so we click on the hexagon.
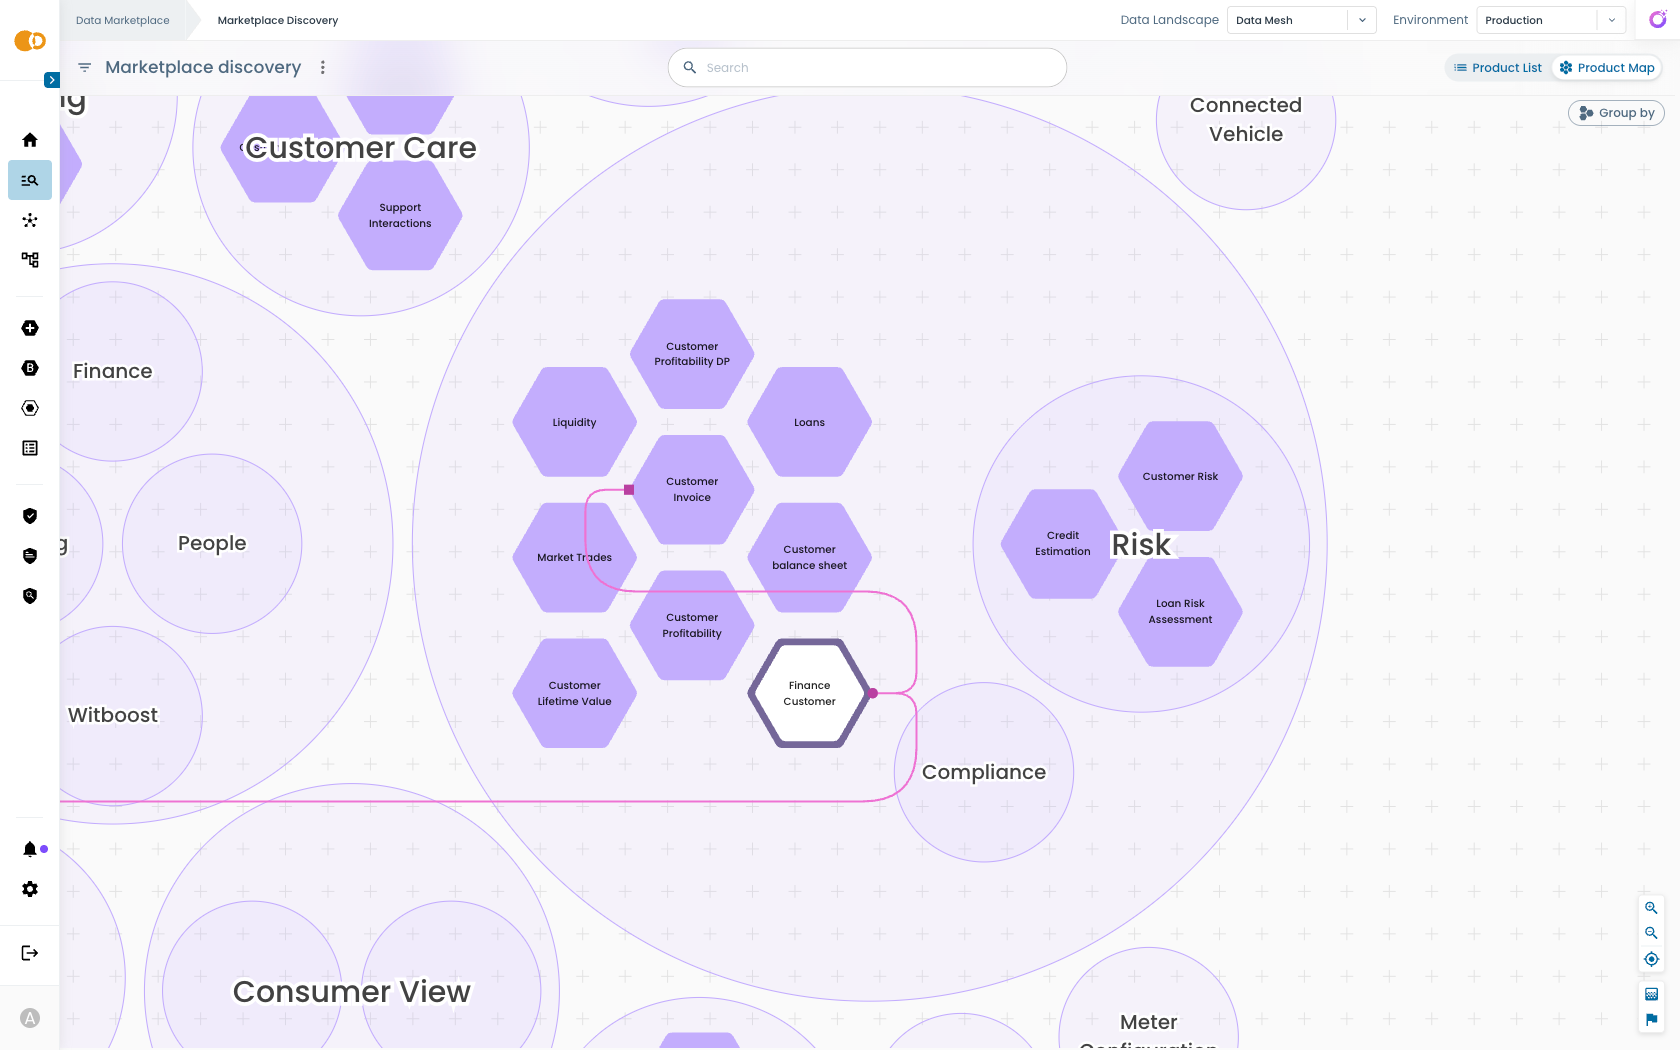
The graph now shows the relationships between the selected product and the other ones. In this case the Finance Customer product is consumed by the Customer Invoice product.
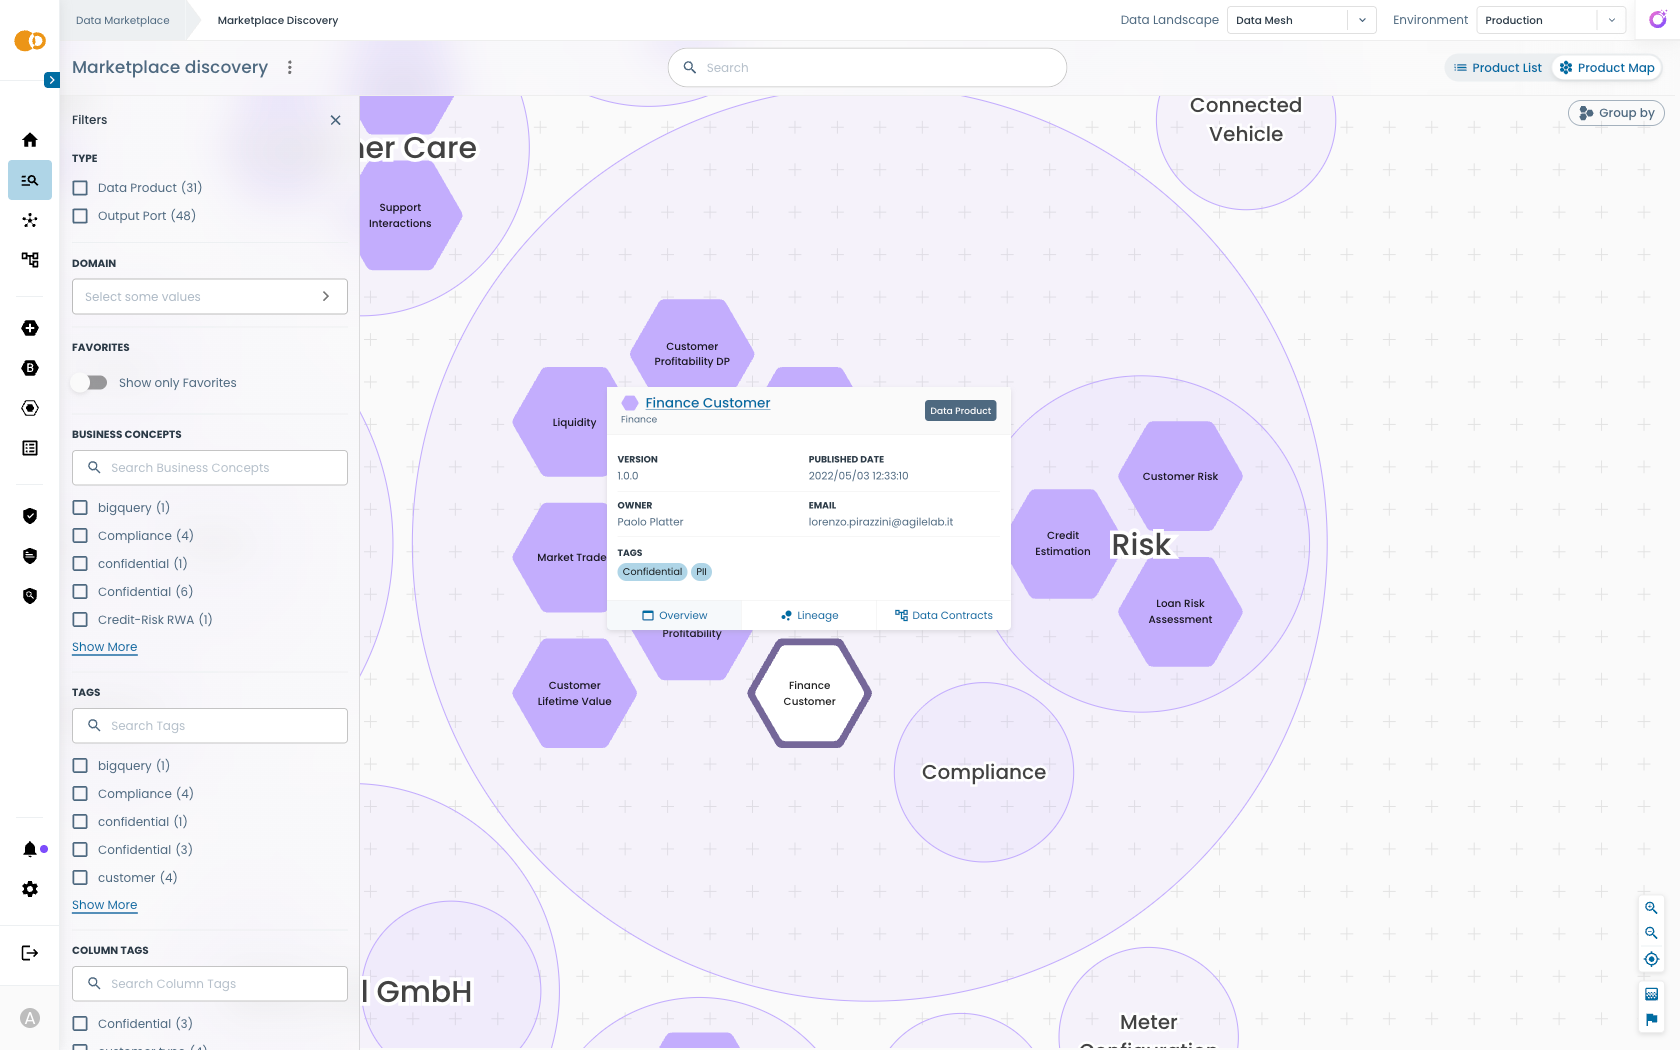
- To have a detailed view on the Finance Customer product, hover on it with your mouse, then click on Overview inside the popover that appears.
Inspecting a Product
Regardless of whether you reached a product from the Product List or from the Product Map, you land on the same product detail page.
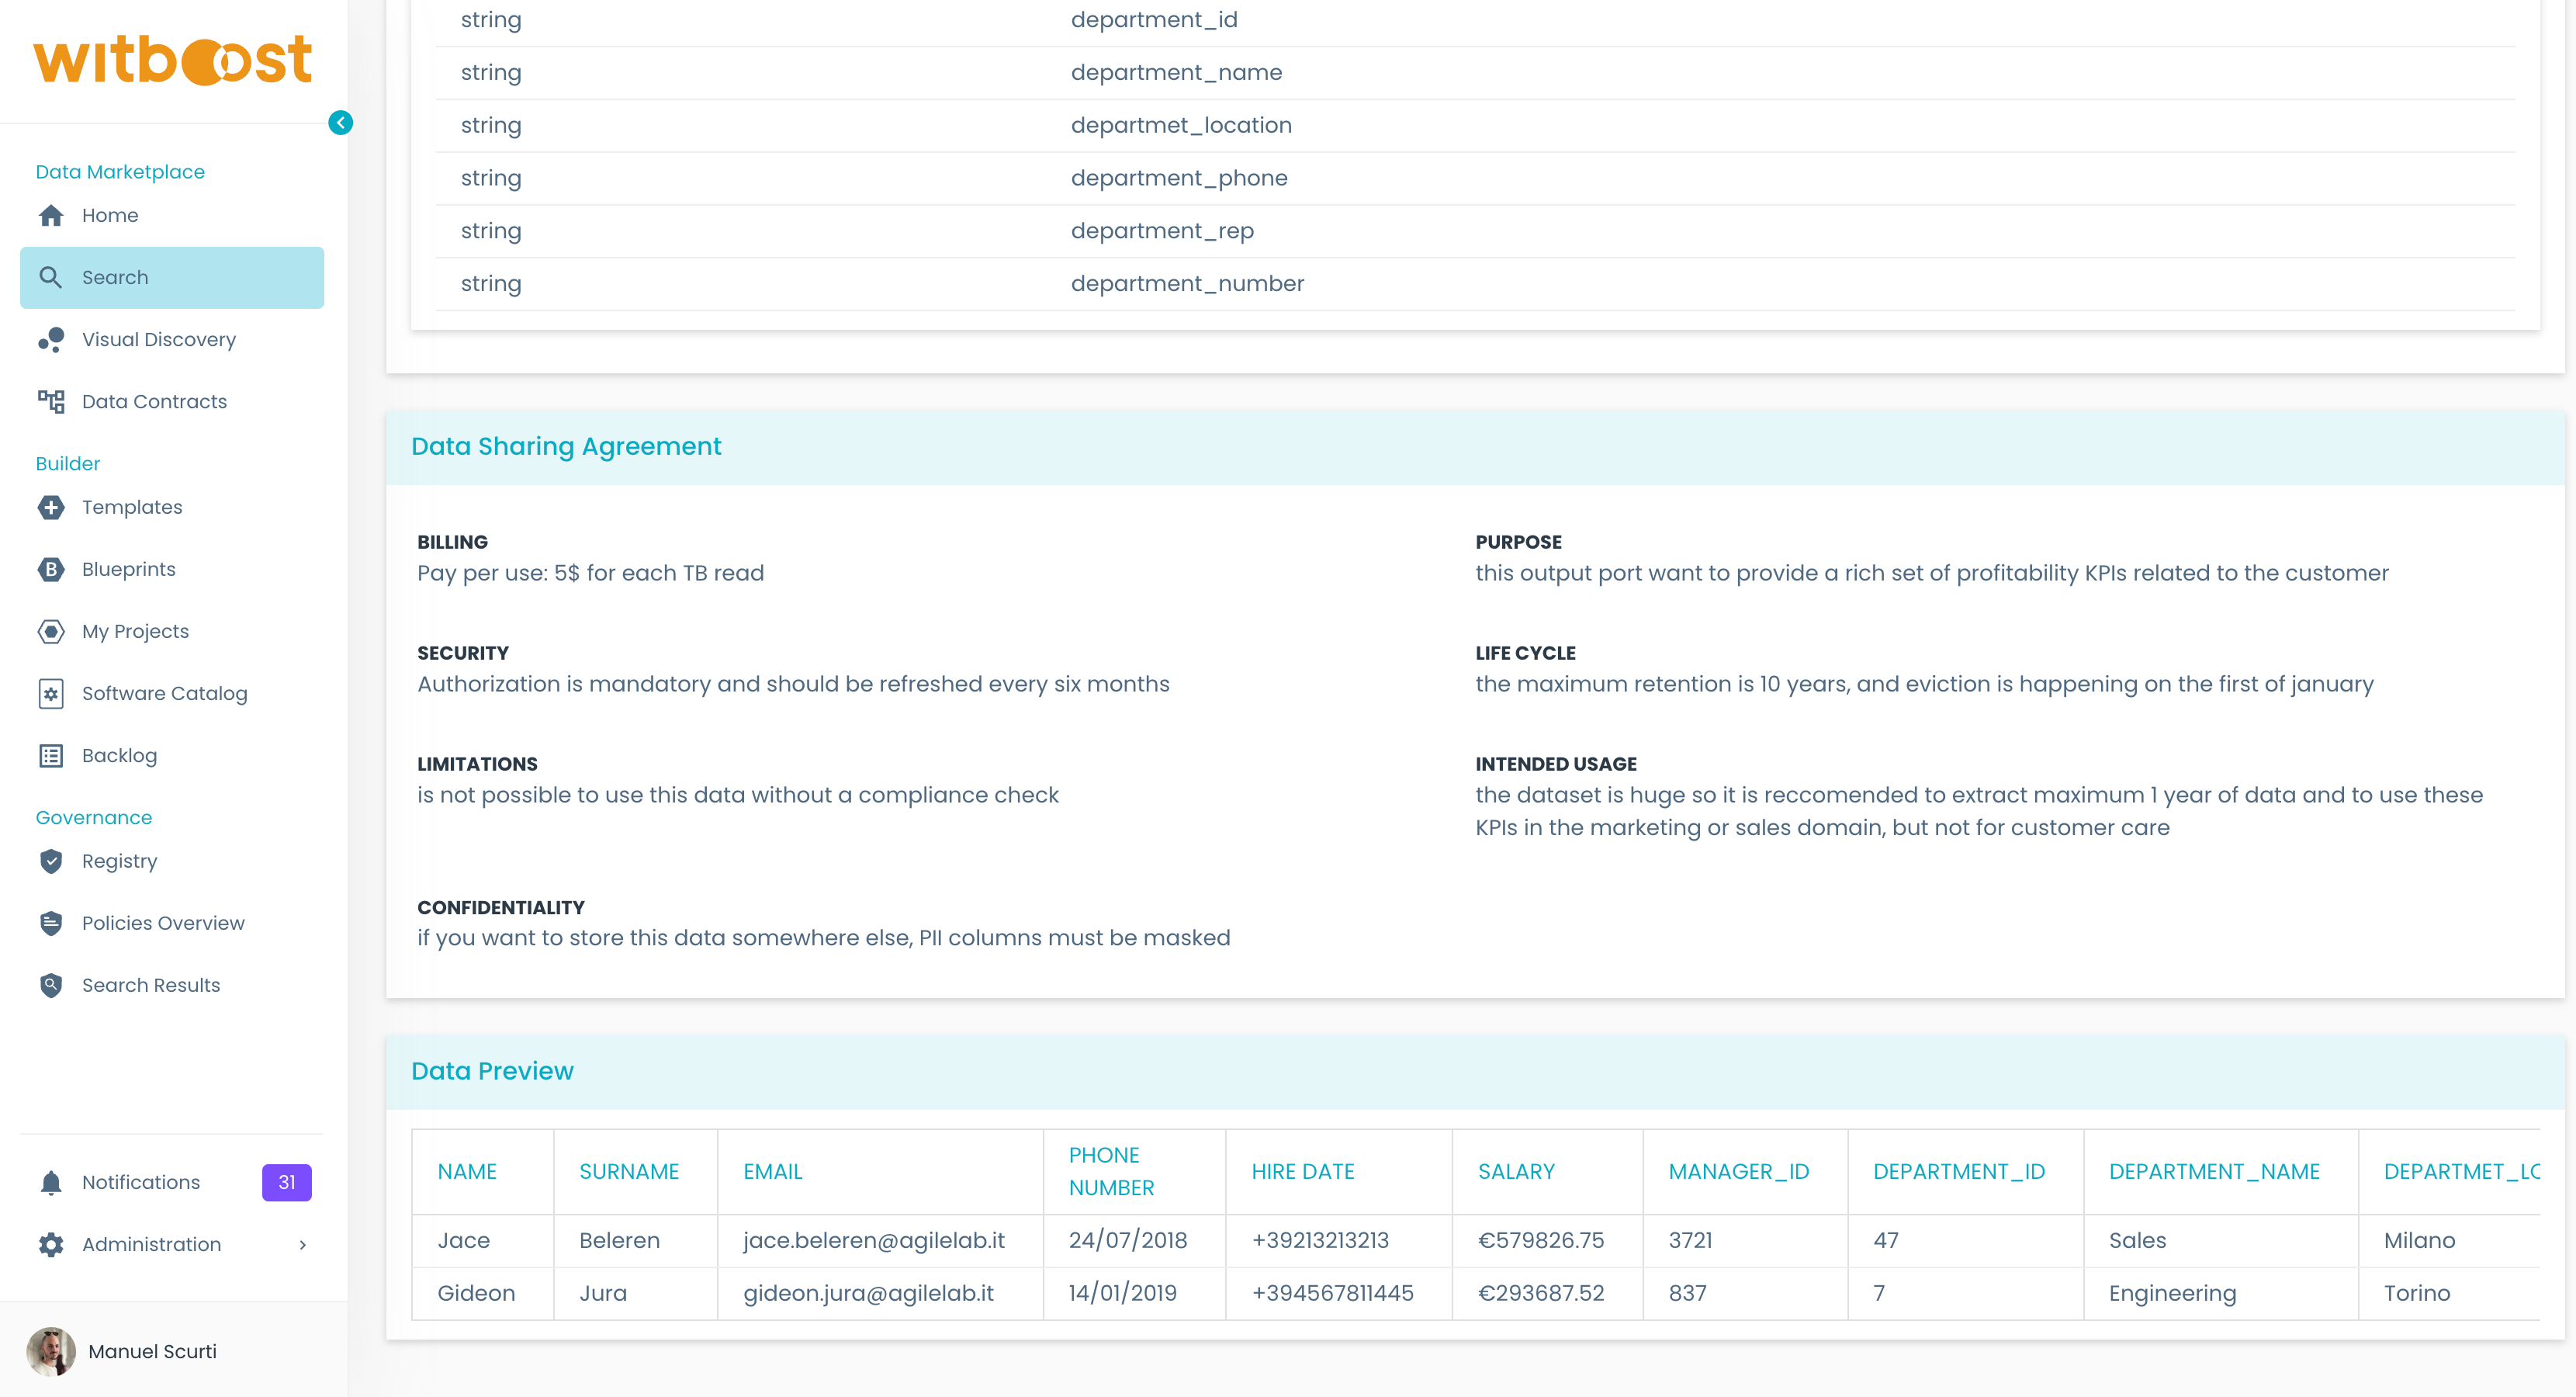
- From the overview page, you can check all the information published by the data team and review the list of its consumable interfaces, which are called Output Ports in the case of the Data Mesh landscape.
- Click on any output port to jump to the details of the published data like data contract schema, data sharing agreement and data preview.
Accessing the Lineage Graph
From the Product Map
If you already use the Product Map tab of Marketplace Discovery to explore domains and products, you can access the Lineage Graph directly from there.
- From the side menu, open Marketplace Discovery, switch to the Product Map tab and navigate the graph until you find the product you are interested in.
- Hover over the product node to open the popover with quick actions.
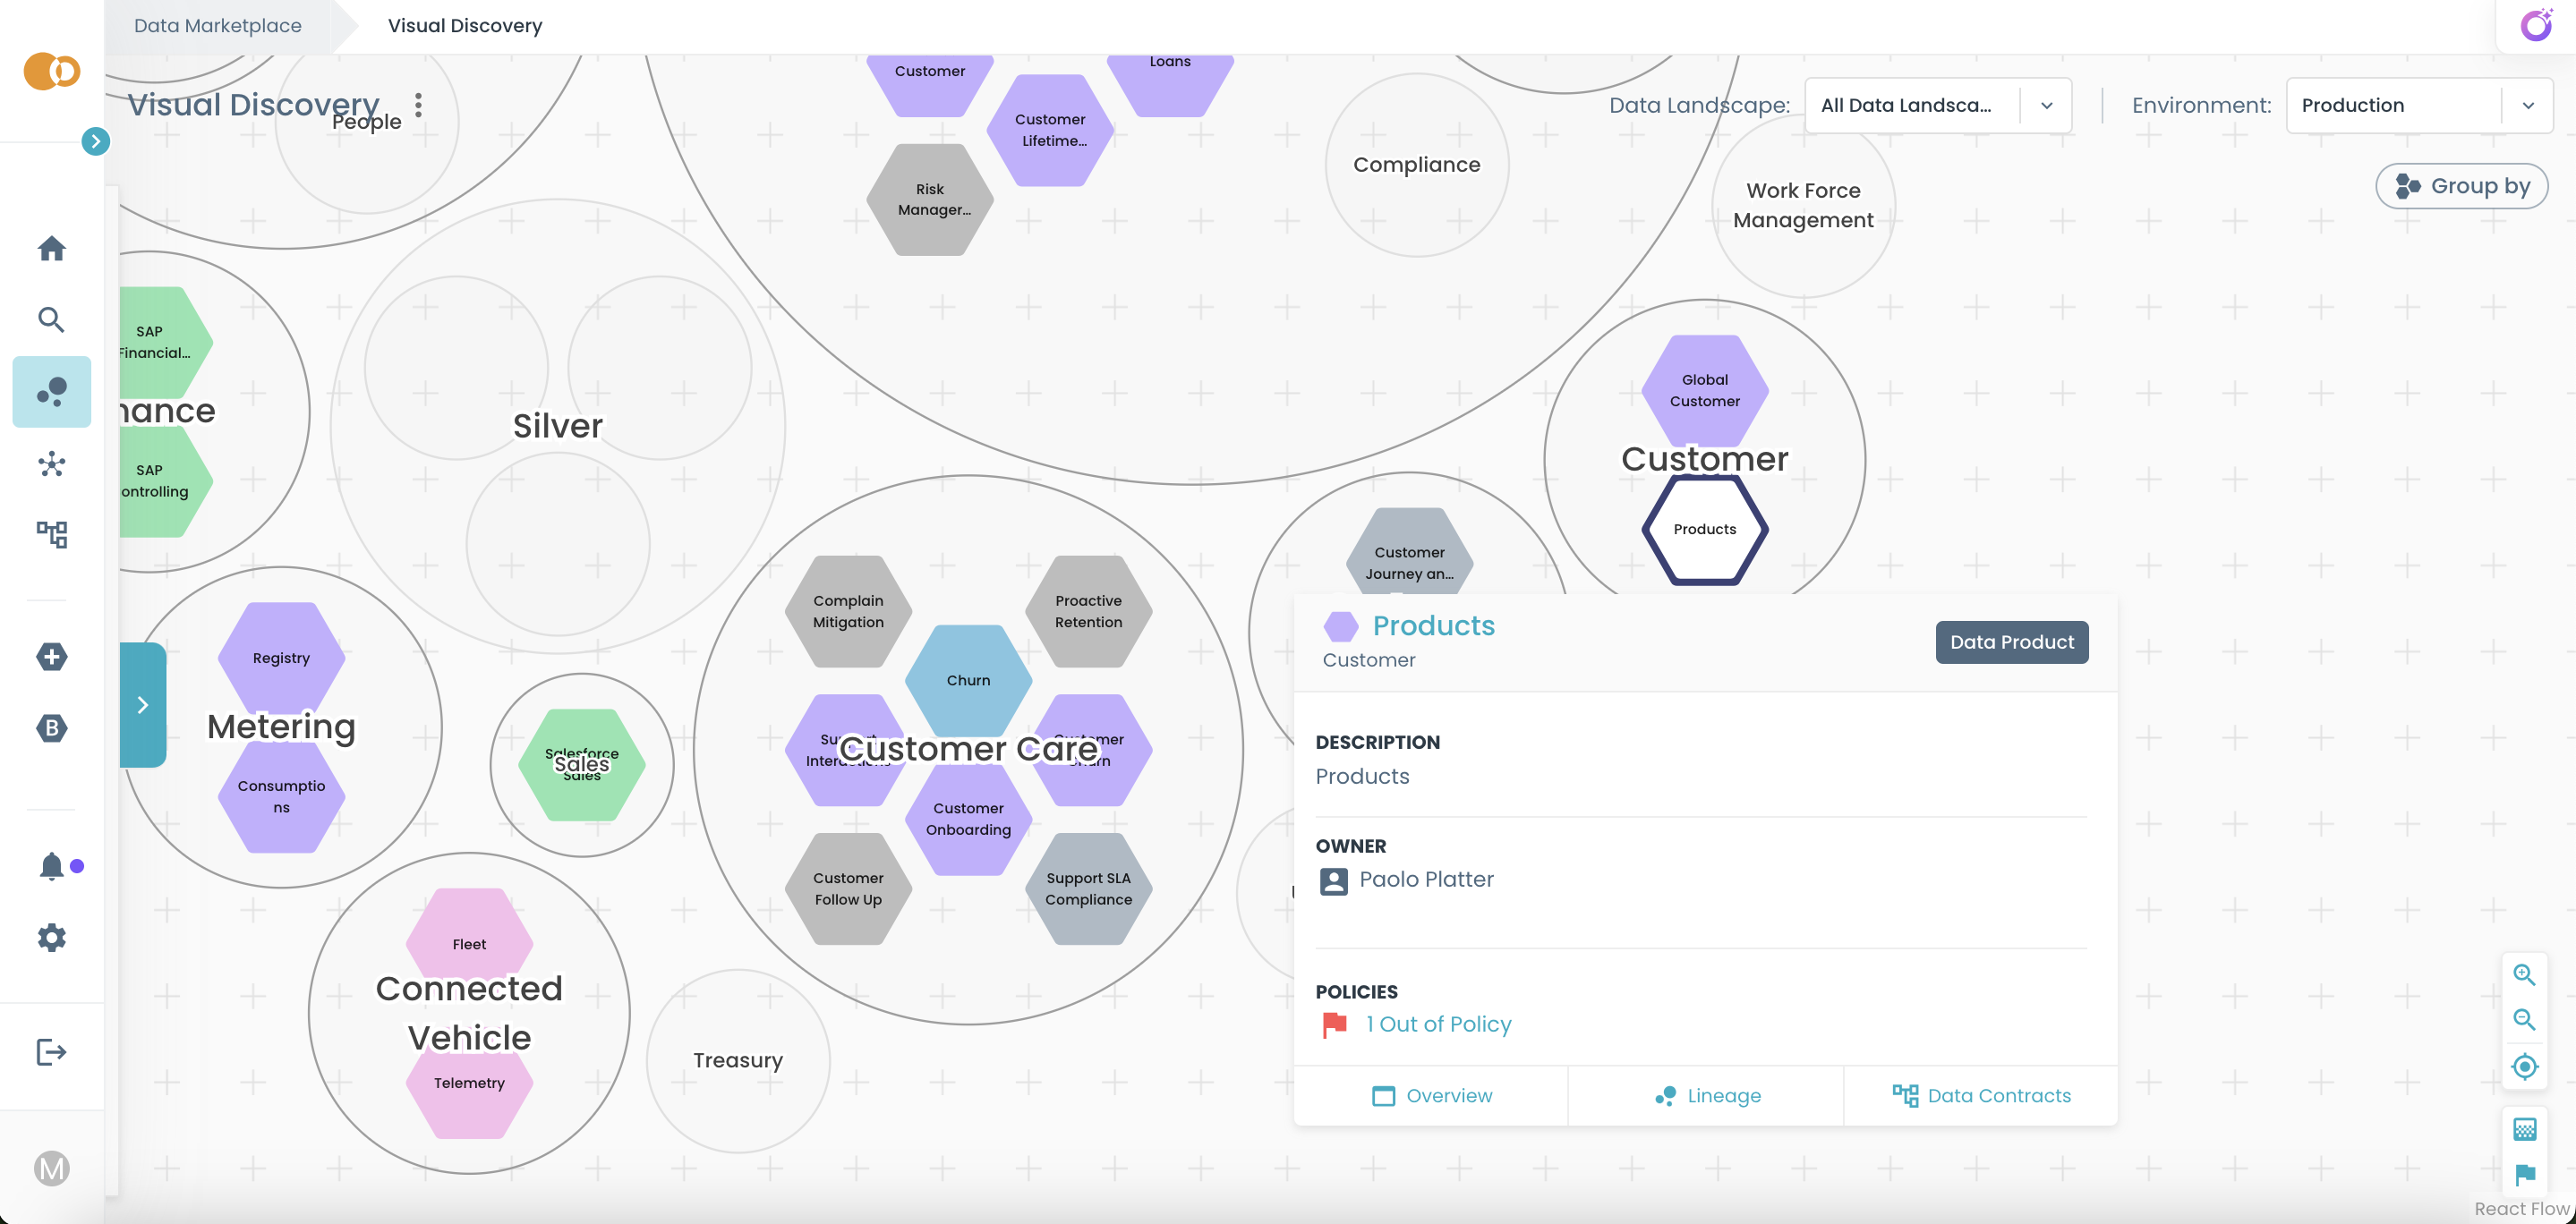
- In the popover, click on Lineage.
Witboost opens the product page on the Lineage tab, displaying the Lineage Graph for that product.
From the Product Page
You can also access the Lineage Graph directly from the detail page of any product.
- Open the Marketplace and search for the product you want to inspect.
- Click on the product to open its overview page.
- In the product navigation tabs, select Lineage.
The Lineage tab loads the graph already focused on the selected product.