Data Discovery
Overview
Data discovery in Witboost is designed to empower users to efficiently find, understand, and evaluate products across the organization. The process combines powerful search capabilities with intuitive visual exploration tools, making it easy for both technical and business users to navigate the data landscape.
It is articulated in two pages:
- The Marketplace Homepage — the Marketplace landing page, offering a quick entry point with a search bar and shortcuts to your most-used products.
- The Marketplace Discovery page — where actual exploration happens, exposing two complementary views via tabs:
- Product List — results presented as a sortable list.
- Product Map — results presented as an interactive graph of products and their relationships.
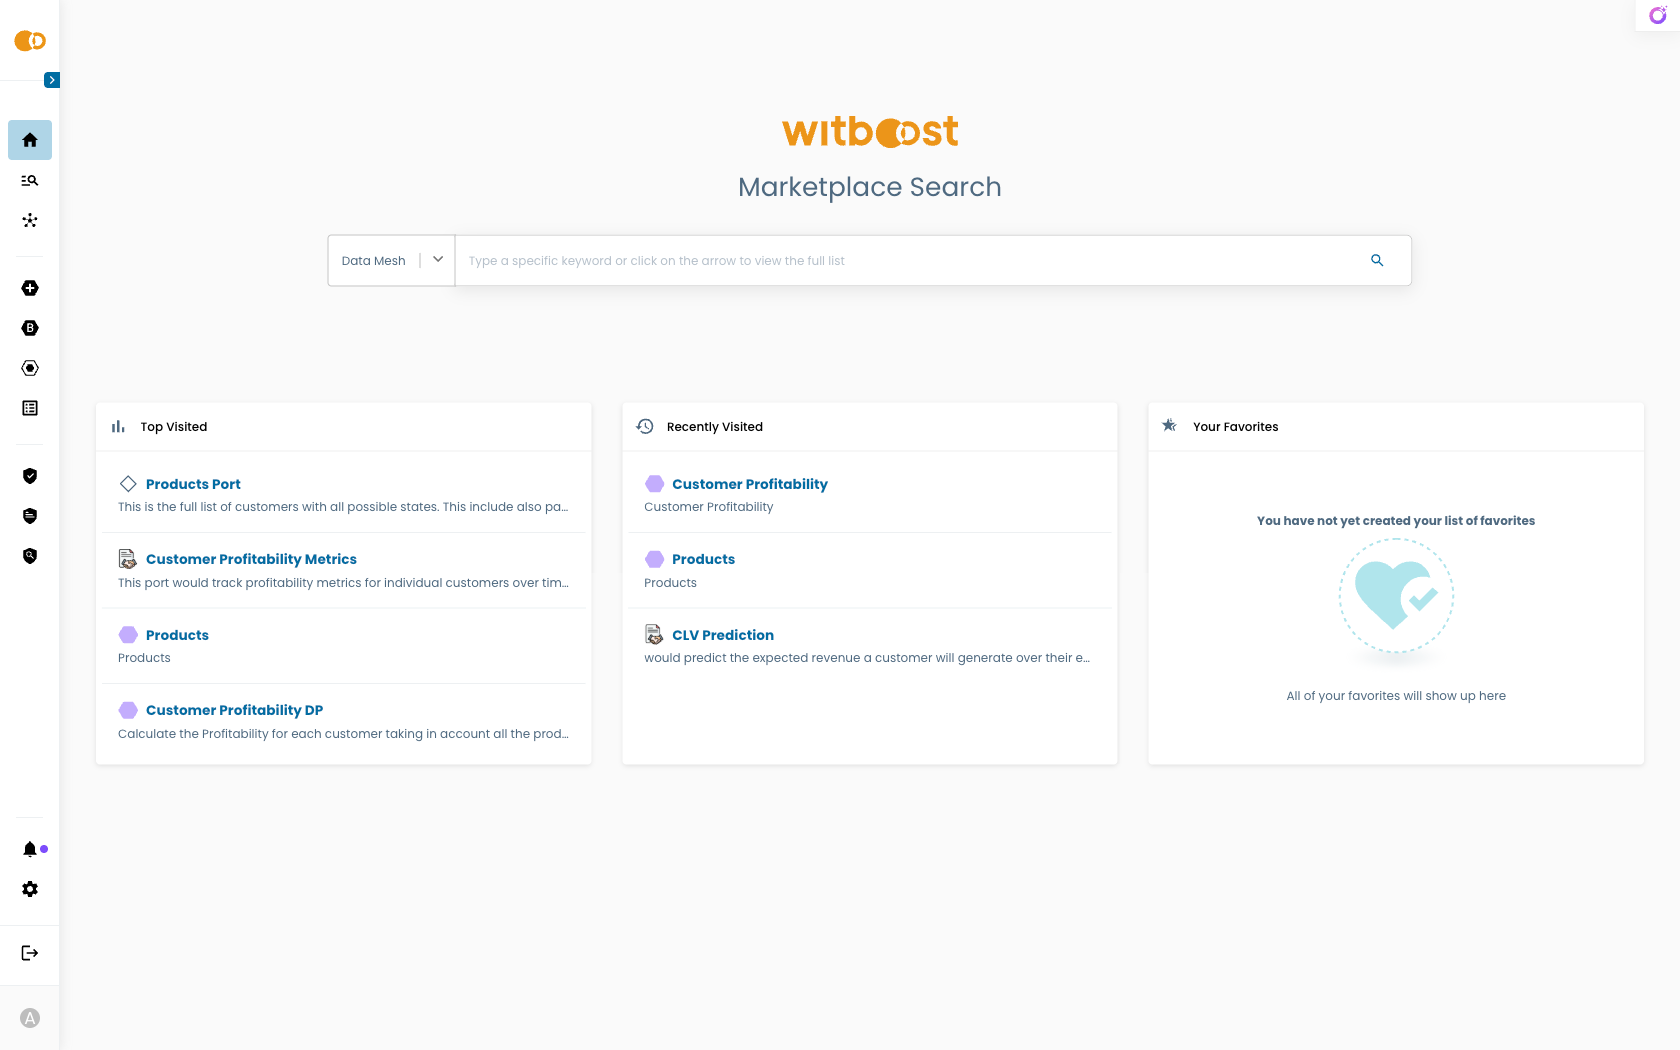
Marketplace Homepage
The Marketplace Homepage is the Marketplace landing page and is designed for quick navigation, making it easy to resume recent activities or explore commonly used products.
Here you can:
- Quickly search by typing a keyword, such as a product name, domain, or tag. Submitting the search opens the Marketplace Discovery page with the query already filled in.
- See Top Visited, Recently Visited, and Favorites sections for quick access to frequently used products.
- Choose the data landscape you want to search within (if multiple are available).
Marketplace Discovery
The Marketplace Discovery page provides the full discovery experience, combining text-based search with visual exploration to help you find and evaluate Products and their Consumables.
You can reach it by:
- Submitting a query from the Marketplace Homepage — your search term is carried over and applied automatically.
- Opening it directly from the side menu.
From here, you can switch between the Product List and Product Map tabs to change the way results are presented, refine results with filters, and pick the data landscape you want to explore.
Product List
The Product List tab is the text-driven view, designed for users who already have an idea of what they are looking for or who prefer a tabular/card layout.
From here, you can:
- Refine search results using advanced filters.
- Sort results by relevance or publication date.
- View key details at a glance, such as:
- Description
- Tags
- Published date
- Version
You can search not only for Products but also their Consumables, giving you full visibility into available outputs and dependencies.
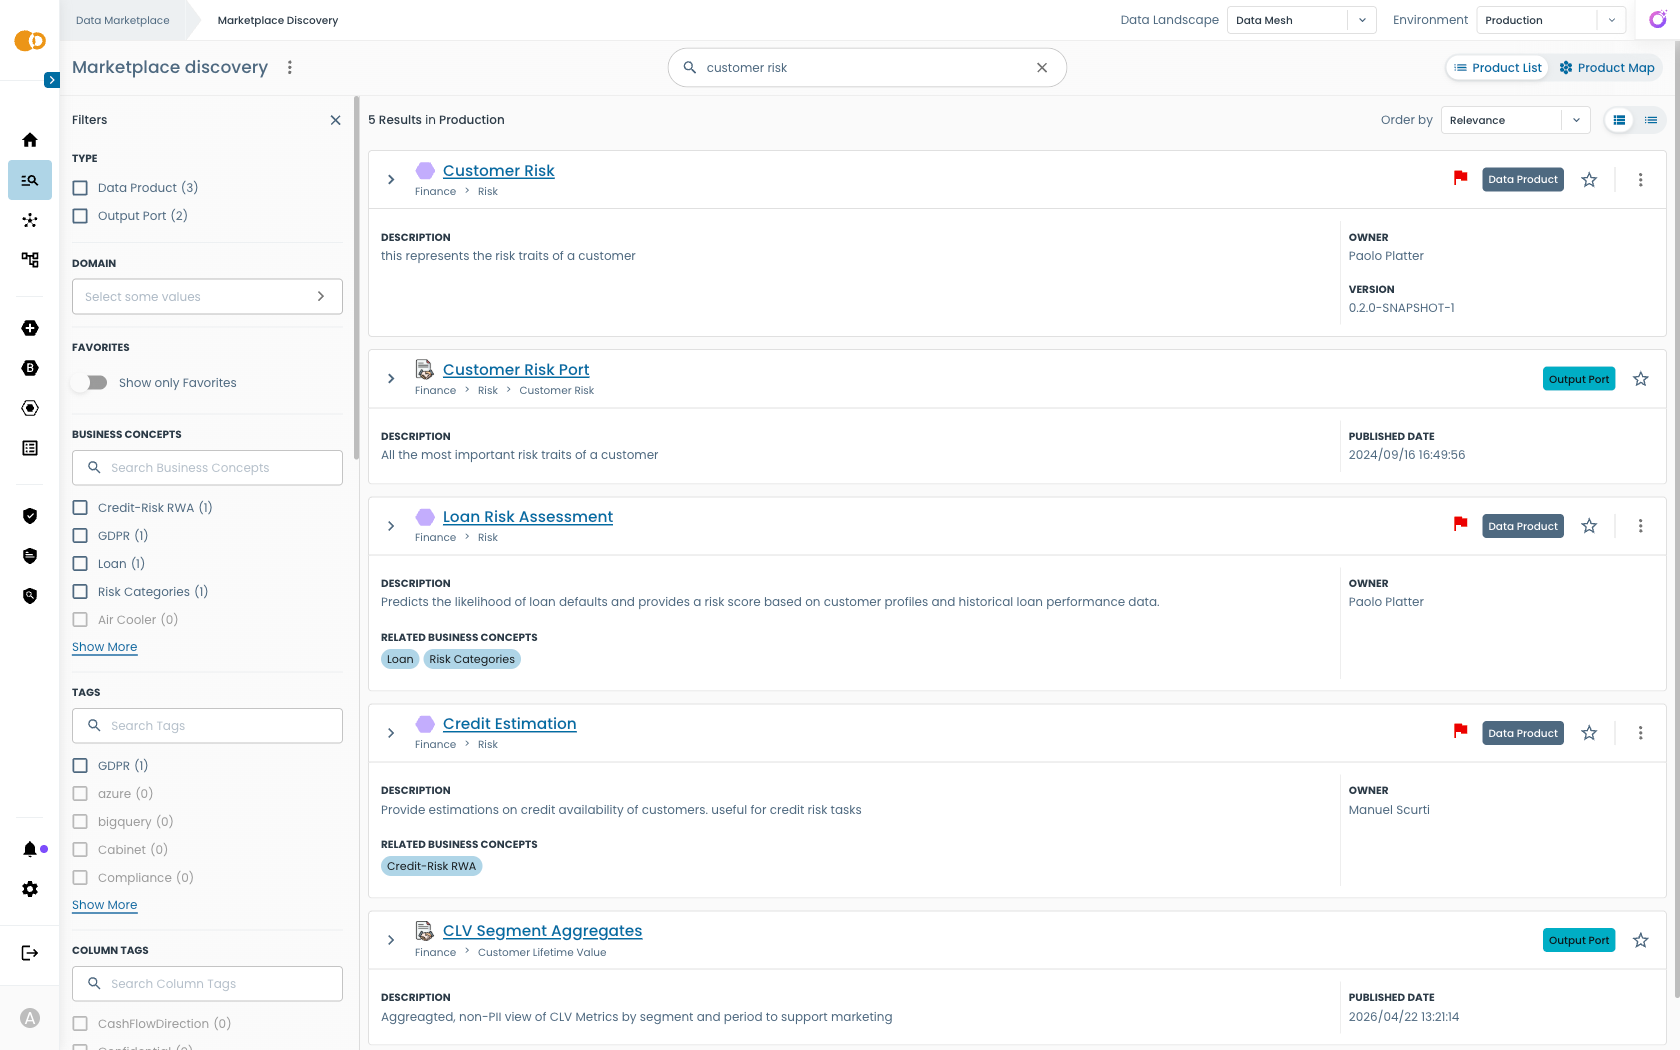
Filters
Filters allow you to narrow down search results to find exactly what you need. These filters are fully configurable by your organization, so they can match business, governance, and operational needs.
Common filter types include:
- Domain: Focus on specific domains.
- Favorites: Show only products you have marked as favorites.
- Tags: Filter based on tags (e.g., GDPR, Confidential, etc.)
- Description: Search for keywords in the product description.
Using multiple filters together helps you progressively refine search results.
Governance Flags
Governance issues detected by Witboost Computational Governance are displayed directly in search results as flags, so you can quickly identify products with:
- Missing metadata.
- Failed validations.
- Policy compliance issues.
This makes it easier to assess data quality and readiness before consuming a product.
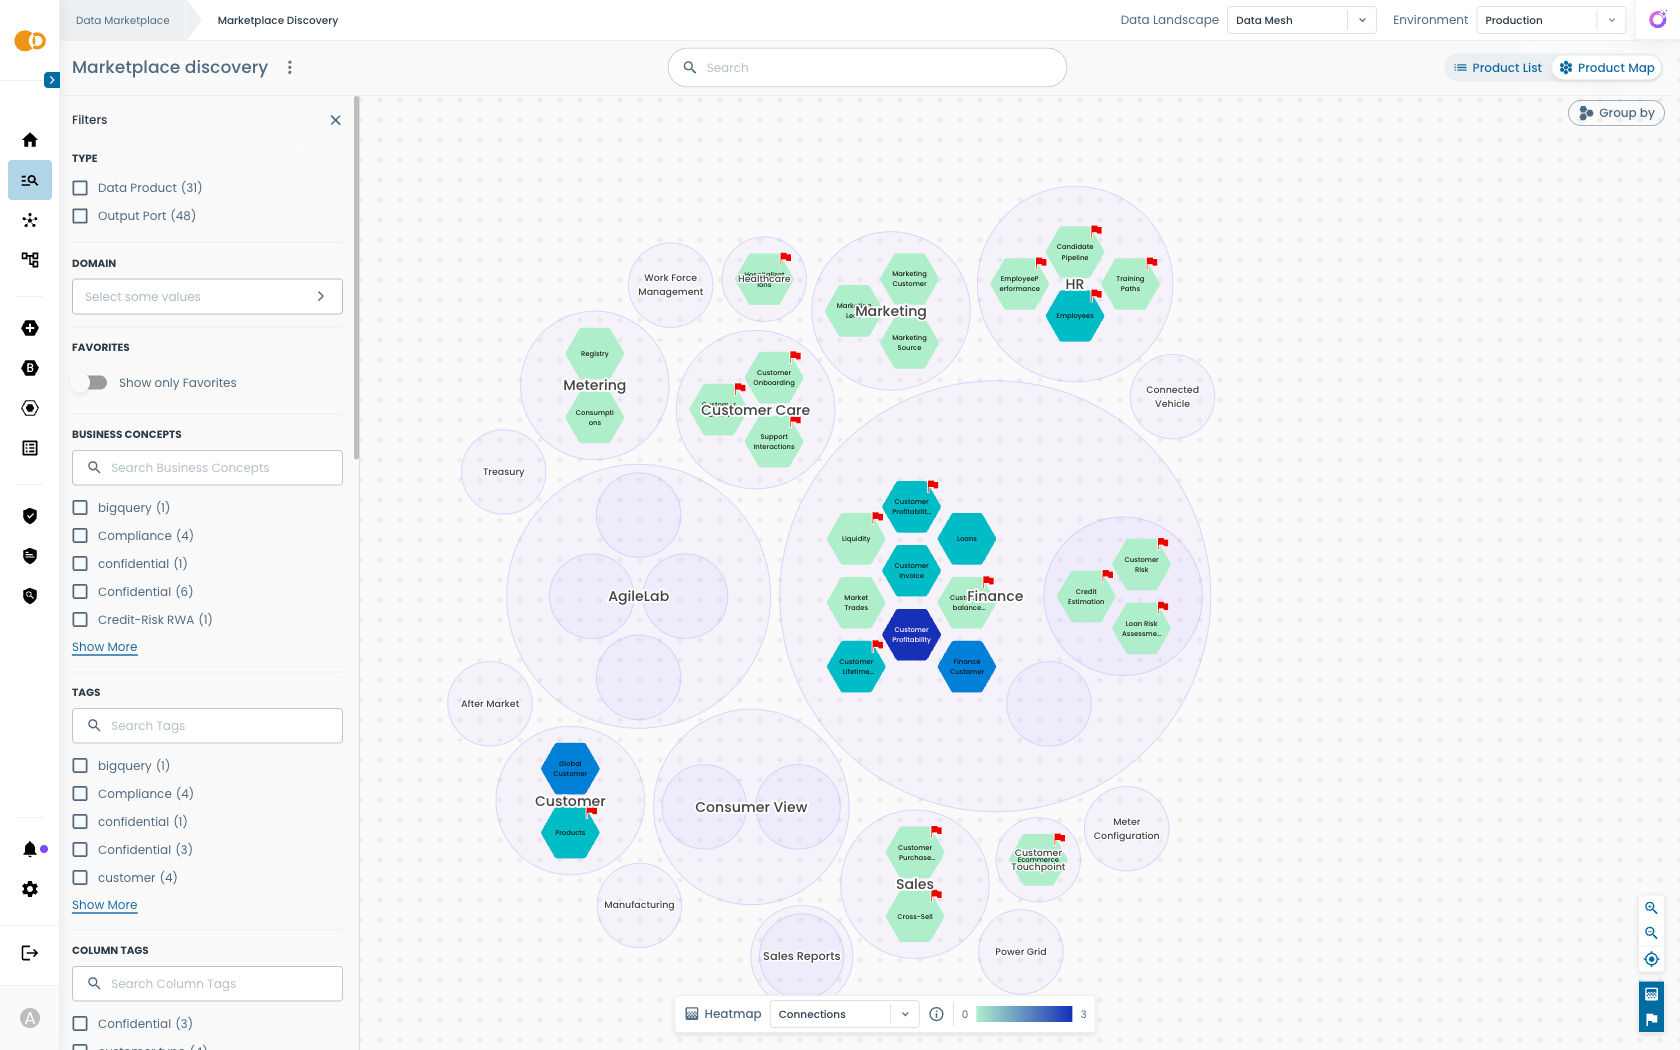
Product Map
The Product Map tab is the visual exploration view of Marketplace Discovery. It provides an interactive, graphical way to explore data within the Witboost Marketplace, helping you understand relationships, domains, and connections across products in a clear and intuitive format.
By default, the Product Map displays Products grouped by domains, giving you an at-a-glance view of how products are organized across your organization. Filters apply here as well, and their are carried over as you switch between tabs.
Key Features
Grouping
When you first open the Product Map, products are grouped by domains by default.
Each domain appears as a cluster, making it easy to identify the products belonging to it.
However, it is possible to customize the grouping logic to analyze data from different perspectives. You can define up to three grouping levels, for example:
- Primary grouping (e.g., Domain).
- Secondary grouping (e.g., Country).
- Tertiary grouping (e.g., Legal Entity).
This flexibility allows you to visualize your data landscape by organizational structure, geographical distribution, or any other relevant attribute.
Example: Group first by Domain, then by Country, and finally by Legal Entity to see how products are distributed across business units and regions.
Connections Between Products
The Product Map graph shows connections between products, helping you understand data flows:
- Input connections show which products provide data to the selected product.
- Output connections show where the selected product shares its data.
This makes it easy to:
- Identify dependencies and upstream/downstream relationships.
- Understand the impact of changes to a product.
- Analyze how data moves through your organization.
Filters
Use the Filters panel to refine what you see in the visualization.
The exact filters available are configured by your organization, meaning they can match your governance and operational needs.
Heatmaps
Heatmaps overlay visual highlights on the graph, helping you identify patterns or issues at a glance.
The available heatmaps are fully configurable by your organization, so you can track metrics that matter most to your business.
Key use cases include:
- Number of connections: quickly identify highly connected products or potential bottlenecks.
- Maturity or lifecycle stages: visualize the readiness of products across the organization.
- Publication date: highlight recently published or updated products to easily spot new additions or track aging assets that may require review or deprecation.
By applying a heatmap, products in the visualization are color-coded, giving you instant visibility into key metrics and relationships.
Governance flags
Governance Flags focus on policy and compliance issues, reported by the Witboost Computational Governance system.
- They visually indicate where governance problems exist, such as missing metadata, failed validations, or other compliance concerns.
- Flags appear directly on products, making it easy to identify issues that require action.
Product Details Panel
Hover on a product node to open a popover with quick information such as description, status, owner, tags, and policy compliance.
From this panel, you can:
- Open the details page for full documentation and output ports.
- View lineage to explore input and output connections.
- Access data contracts if the product exposes or consumes any.
Why Use the Product Map
The Product Map helps you quickly understand and manage your organization's data by providing a clear, interactive view of relationships and dependencies. It allows you to:
- Explore relationships: see how products are connected through input and output flows.
- Identify critical nodes: use heatmaps to highlight highly connected or high-traffic products.
- Understand organization: view how products are structured across domains, regions, or other business dimensions.
- Simplify impact analysis: quickly assess the potential effects of changes through a visual, intuitive interface.
This makes it easier for both technical and business users to discover, evaluate, and manage products effectively.